
Utility-scale solar PV design and construction engineering support
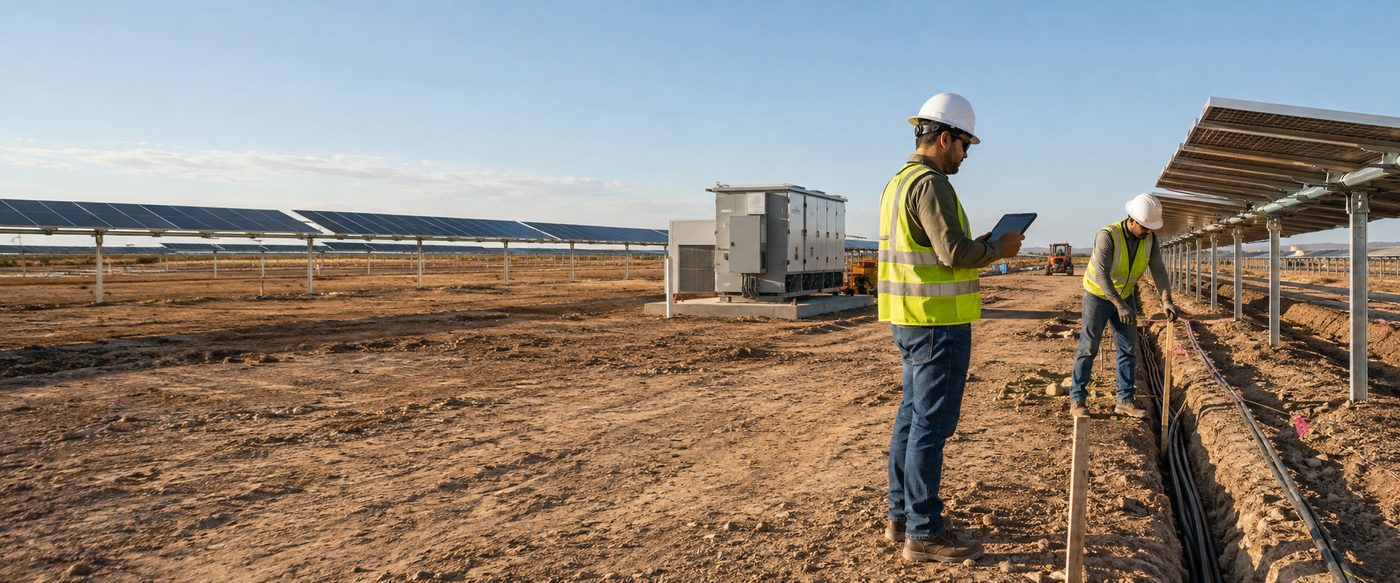
An independent power producer and EPC delivery team developing a tracker project on the West Texas High Plains.
- Input received
- Boundary, title, wetland and environmental constraint layers, topographic survey and geotechnical basis, module/tracker/inverter/transformer equipment data, and the interconnection agreement's POI voltage, export limit and reactive-power criteria.
- Delivered
- Tracker-row and equipment layouts, DC/MV single-line diagrams, grounding and trench details, cable and equipment schedules, a BOM/BOQ by block and feeder, and a voltage-drop/ampacity/DC-AC-ratio reconciliation workbook.
- Timeline
- Eight Pathworks production weeks after approved survey, geotechnical basis, equipment data and interconnection requirements. Excludes client review, utility and AHJ cycles.
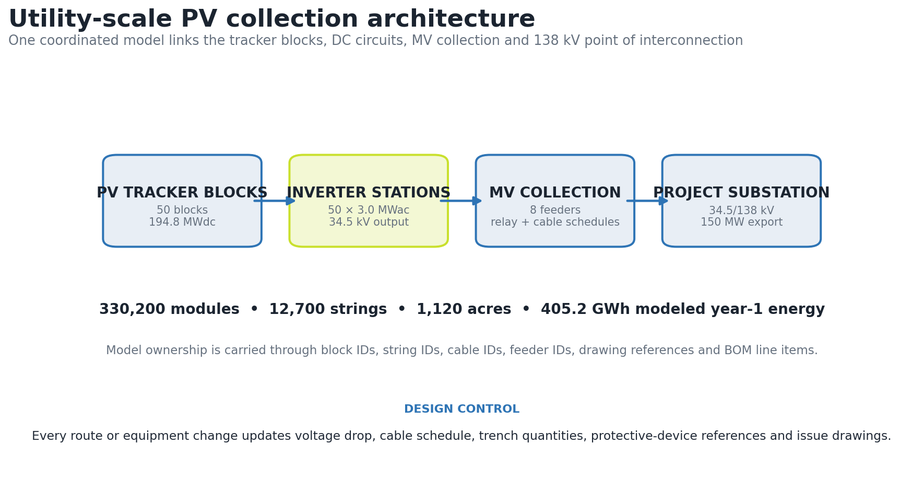
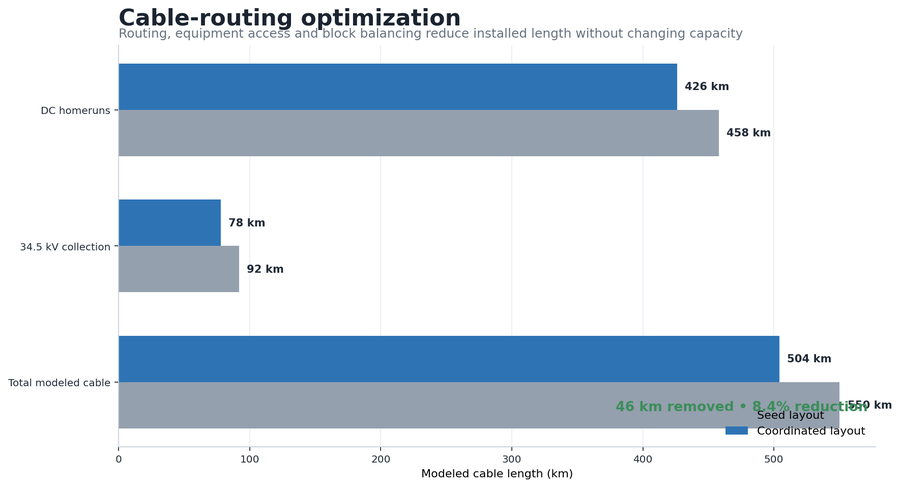
One ID-controlled site and electrical model carries a route change through voltage drop, cable length, trench quantities, crossing schedules and drawing references together. The representative design delivers 194.8 MWdc / 150 MWac across 1,120 acres with a 1.299 DC/AC ratio, reduces modeled cable from 550 km to 504 km, and closes 77 of 91 conflicts in the Pathworks coordination register before issue.
- PV array
- 194.8 MWdc
- Export capacity
- 150 MWac
- Modeled year-1
- 405.2 GWh
- Cable reduction
- 8.4%
The engineering problem
The seed layout meets the nameplate target but does not yet behave as a construction model. Tracker rows cross drainage controls, block boundaries do not align with inverter access, cable routes duplicate trenching, and the original inverter grouping creates uneven collection-feeder loading. The task is to hold the interconnection capacity, DC/AC ratio and energy basis while converting the conceptual layout into controlled equipment, cable, trench, grounding, communications, road and drawing schedules, so every quantity traces back to a spatial feature and every field exception has an owner.
Design parameters and calculation basis
| DC nameplate | 330,200 modules × 590 W = 194.818 MWdc |
|---|---|
| AC nameplate | 50 inverter stations × 3.0 MWac = 150.0 MWac |
| DC/AC ratio | 194.818 ÷ 150.0 = 1.299 |
| Stringing | 26 modules/string; 254 strings per block; 12,700 total strings |
| Land use | 1,120 acres ÷ 194.818 MWdc = 5.75 acres/MWdc |
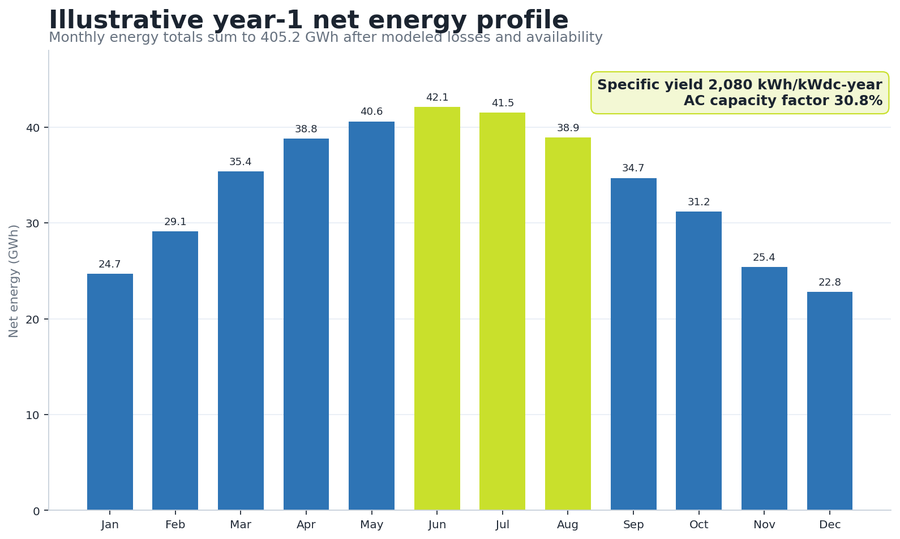
| Energy basis | 405.2 GWh ÷ 194.818 MWdc = 2,080 kWh/kWdc-year (single-axis tracker; 7.5% bifacial gain on 0.25 ground albedo) |
| AC capacity factor | 405.2 GWh ÷ (150 MW × 8,760 h) = 30.8% |
| Worst modeled drops | 1.42% DC homerun and 1.71% MV feeder at representative maximum-power conditions |
Key design decisions
Fifty equal-capacity inverter blocks are standardized so tracker, electrical, SCADA and BOQ packages share the same work-breakdown structure. Inverter stations are shifted toward cable-weighted block centroids while preserving flood, access, fire and maintenance constraints. Eight MV feeders are balanced by both apparent power and route exposure rather than optimizing length at the expense of ampacity or protection selectivity — each feeder carries approximately 18.8 MVA (≈314 A at 34.5 kV) on 1,000 kcmil aluminum sized with direct-buried derating applied. Road, trench and cable crossings are carried as named schedule events rather than relying on graphical intersections alone.
Design and quantity control
| Control item | Seed basis | Coordinated basis | Result / acceptance |
|---|---|---|---|
| DC blocks | 50 unequal conceptual areas | 50 × 3.896 MWdc | 1.299 DC/AC ratio |
| DC homeruns | 458 km | 426 km | 7.0% reduction |
| MV collection | 92 km | 78 km | 15.2% reduction |
| Total modeled cable | 550 km | 504 km | 46 km / 8.4% removed |
| Coordination conflicts | 91 identified | 77 closed; 14 held | Every open item has owner and due date |
QA steps and evidence
| QA gate | Acceptance test | Evidence / result |
|---|---|---|
| Capacity | Module, string, block and inverter totals reconcile | 194.818 MWdc / 150.0 MWac |
| Cable | GIS length, schedule length and BOQ length agree | 504 km modeled total |
| Electrical | Ampacity and representative voltage-drop limits satisfied | 1.42% DC / 1.71% MV worst modeled |
| Civil interface | Rows and trenches clear approved constraints | 77 conflicts closed; 14 controlled holds |
| Issue control | Drawings, schedules and BOM carry matching revision | Three formal design releases |
Revision record
| Release | Trigger | Change made | Controlled outcome |
|---|---|---|---|
| 30% | Survey and constraint composite | Shifted 312 tracker rows; relocated six inverter pads | Buildable block geometry established |
| 60% | Cable and access optimization | Rebalanced feeders; removed 46 km modeled cable | Voltage drop and access targets met |
| IFC support | Vendor and EPC review | Updated equipment, trenches, schedules and BOQ | Controlled construction support package |
Result and calculation trail
The representative design delivers 194.818 MWdc / 150 MWac across 1,120 acres with a 1.299 DC/AC ratio. The coordinated model produces 405.2 GWh of illustrative year-1 energy, reduces modeled DC and MV cable from 550 km to 504 km, and closes 77 of 91 spatial or constructability conflicts before issue.
DC nameplate: 330,200 modules × 590 W = 194,818,000 Wdc. Specific yield: 405,200 MWh ÷ 194,818 kWdc = 2,080 kWh/kWdc-year. AC capacity factor: 405,200 MWh ÷ (150 MW × 8,760 h) = 30.8%. Cable reduction: (550 − 504) km ÷ 550 km = 8.4%.
Pathworks converted a representative 194.8 MWdc tracker concept into a coordinated solar construction model covering site layout, DC and MV collection, single-lines, schedules, trench plans and BOQ, reducing cable routing by 8.4 percent while capacity, access and electrical checks remained controlled.
More case studies
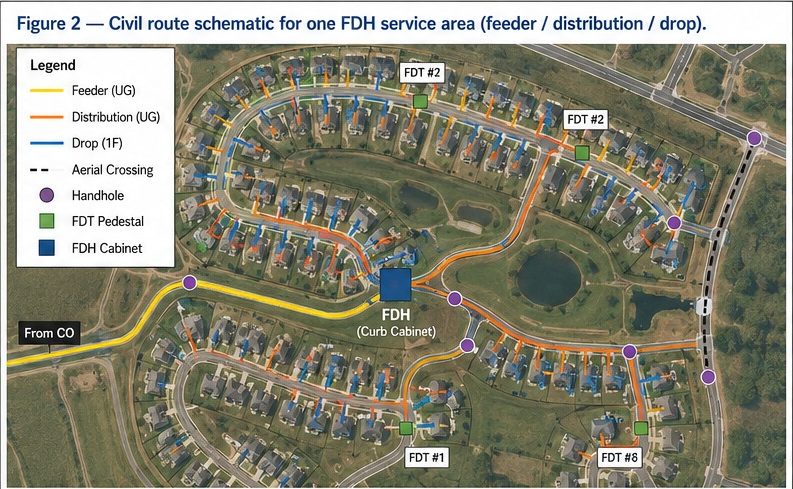

Greenfield FTTH design for 500 homes, full OSP package from plat to BOM
Built to standard US ILEC/CLEC practice: a two-stage 1:4/1:8 split localizes fault response to a single FDT instead of the whole feeder, construction runs underground-first to meet HOA aesthetic requirements, and 20–30% spare fiber is held at every tier so the network can absorb infill lots without a re-trench. The design closes with 7.4 dB of optical margin against the 28 dB GPON Class B+ budget, enough headroom for a future 1:64 upgrade at a subset of FDTs.
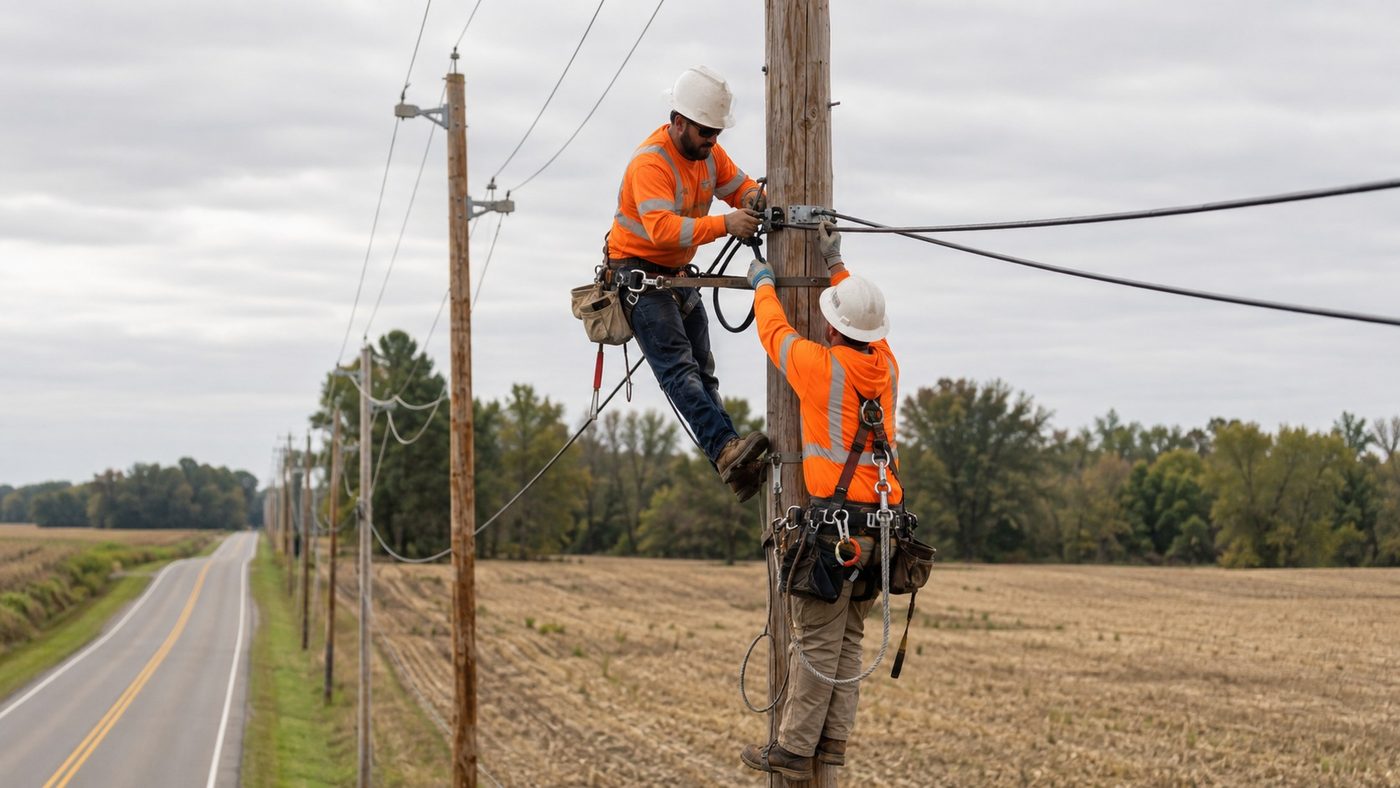
Rural greenfield FTTH design for a 500-location BEAD service area
A two-stage 1:32 split architecture assigns all 500 approved locations to complete XGS-PON paths across 512 terminal ports. Route optimization reduces the seed alignment from 35.7 to 33.0 miles, a 7.6% reduction, while the modeled planning cost falls from $9,460 to $8,940 per passing and the worst modeled path retains 4.74 dB of N2 optical margin.
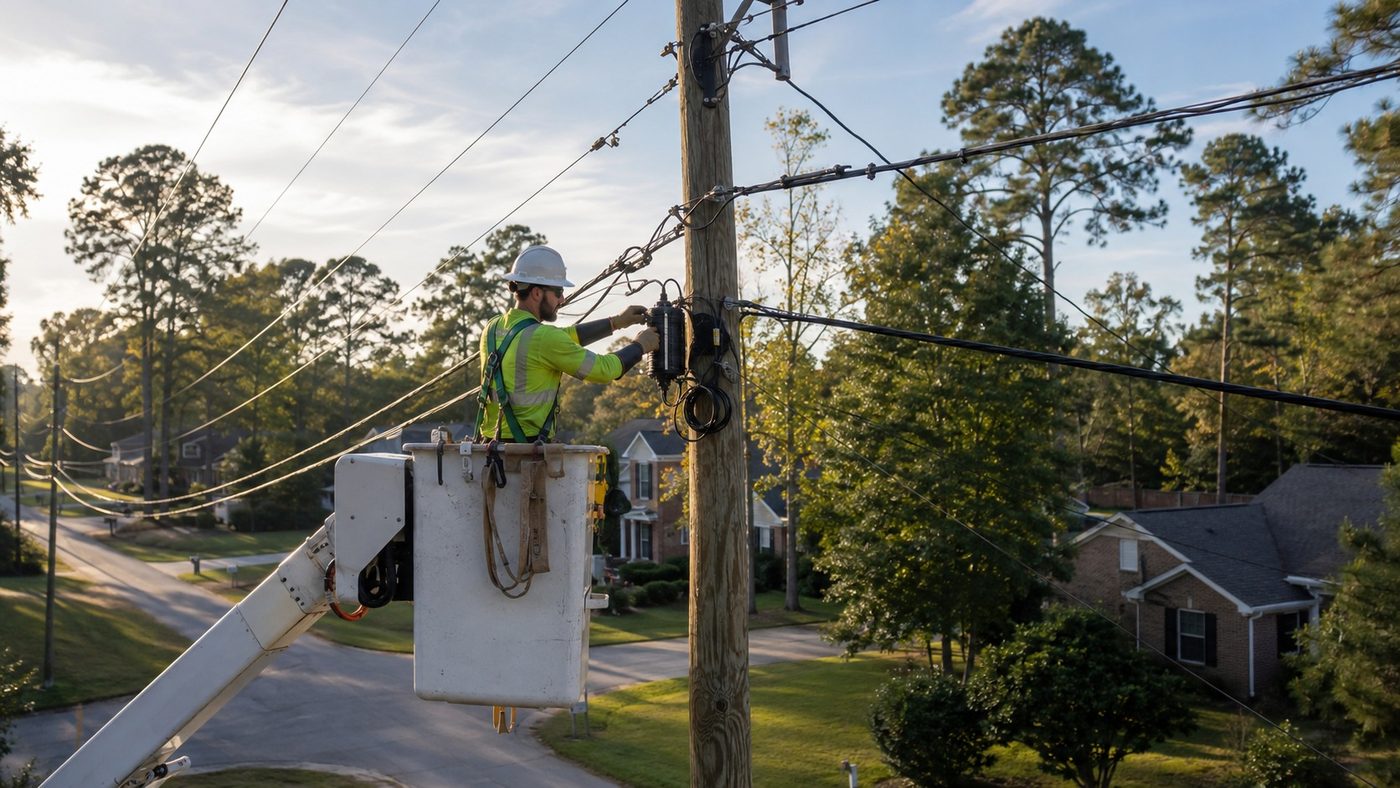
Aerial FTTH design and pole make-ready analysis
A pole-by-pole evidence record separates clean attachment candidates from conditions that require transfer, rearrangement, guying review or replacement. The modeled review identifies 226 make-ready or data conflicts across 1,946 poles; design adjustments resolve 141 before application packaging, including 15 avoided pole-replacement candidates, reaching 92% first-submission readiness.