
Rural greenfield FTTH design for a 500-location BEAD service area
A regional electric cooperative and broadband provider preparing a rural fiber subgrant build across Southern Missouri small-town edge and rural road corridors.
- Input received
- FCC Fabric location IDs and the approved in-scope list, road/parcel/municipal GIS layers, a pole inventory with owner and coordinates, existing transport handoff constraints, aerial imagery and the client's unit-cost library.
- Delivered
- A construction-oriented XGS-PON package: HLD/LLD, GIS geodatabase and KMZ, cable schematic and splice diagrams, splitter/terminal schedules, route-segment BOM, and a permit-jurisdiction and QA register.
- Timeline
- 22 business days from approved input freeze to final design issue.
A two-stage 1:32 split architecture assigns all 500 approved locations to complete XGS-PON paths across 512 terminal ports. Route optimization reduces the seed alignment from 35.7 to 33.0 miles, a 7.6% reduction, while the modeled planning cost falls from $9,460 to $8,940 per passing and the worst modeled path retains 4.74 dB of N2 optical margin.
- Premises passed
- 500
- Route designed
- 33.0 mi
- Worst-path margin
- 4.74 dB
- Modeled cost/passing
- $8,940
The engineering problem
The service area covers low-density communities, farms and roadside clusters separated by long transport segments. The demand layer contains duplicate coordinates, unit-address gaps and locations positioned at parcel centroids rather than likely service entrances. Pole data is incomplete outside the main roads, and several proposed segments cross state highways, streams or railroad-adjacent property. The design begins with a frozen location list, not a route sketch: every approved Fabric location is assigned to one FDT port, one secondary splitter, one primary splitter output, one OLT port and one construction phase, and that chain is carried through the GIS, splice schedule, optical workbook and BOM.
Design parameters and first-principles checks
| Approved service locations | 500 unique location IDs; unit exceptions resolved before zoning |
|---|---|
| Access technology | XGS-PON; 16 active OLT PON ports |
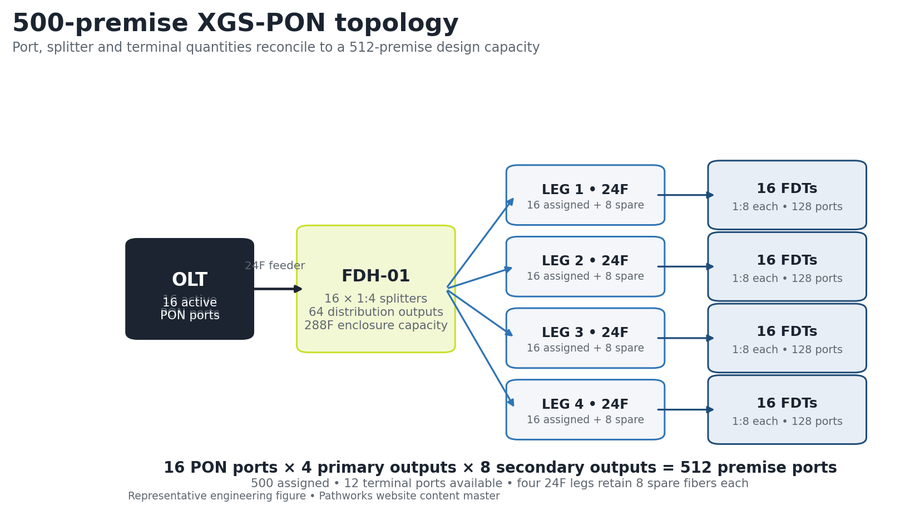
| Split architecture | 16 × 1:4 primary modules at FDH-01; 64 × 1:8 secondary splitters at FDTs; total split 1:32 |
| Subscriber capacity | 512 terminal ports; 500 assigned; 12 available |
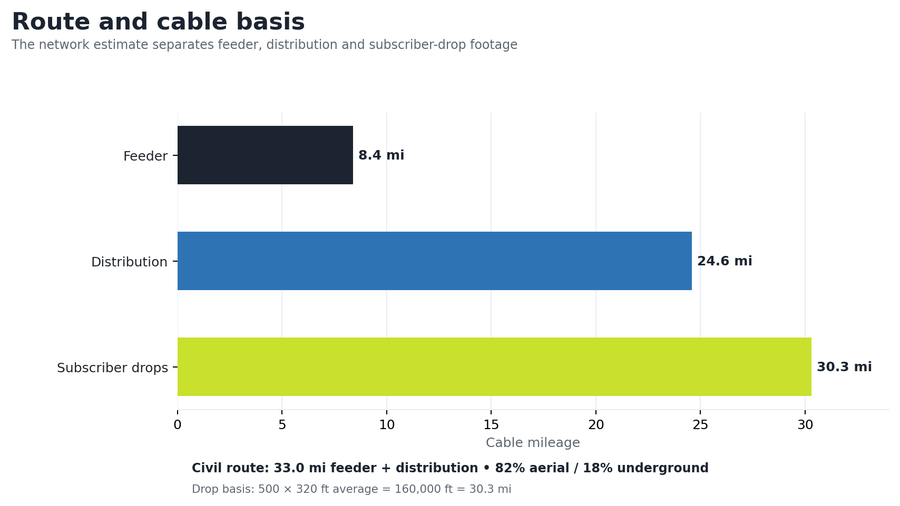
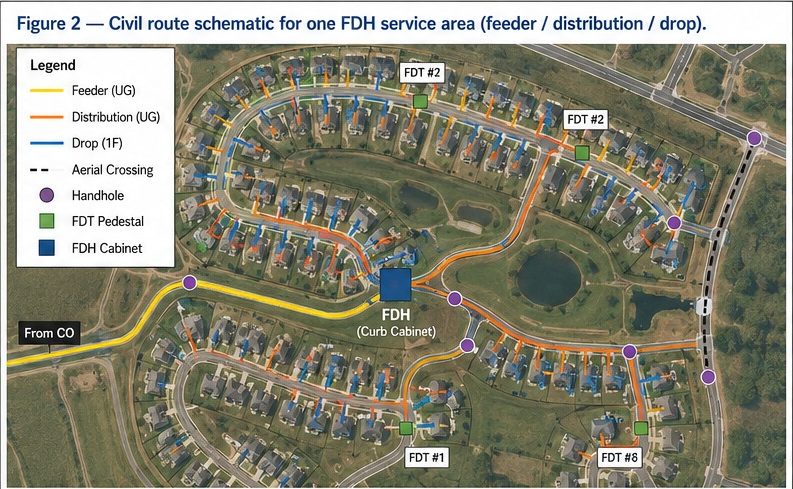
| Feeder | 8.4 route miles; 24F minimum planning cable; 16 assigned fibers + 8 spare |
| Distribution | Four 24F legs totaling 24.6 route miles; 16 assigned + 8 spare fibers per leg |
| Drop basis | 500 × 320 ft average = 160,000 ft / 30.3 cable miles |
| Civil mix | 82% aerial; 18% underground; 32 underground access/pull points |
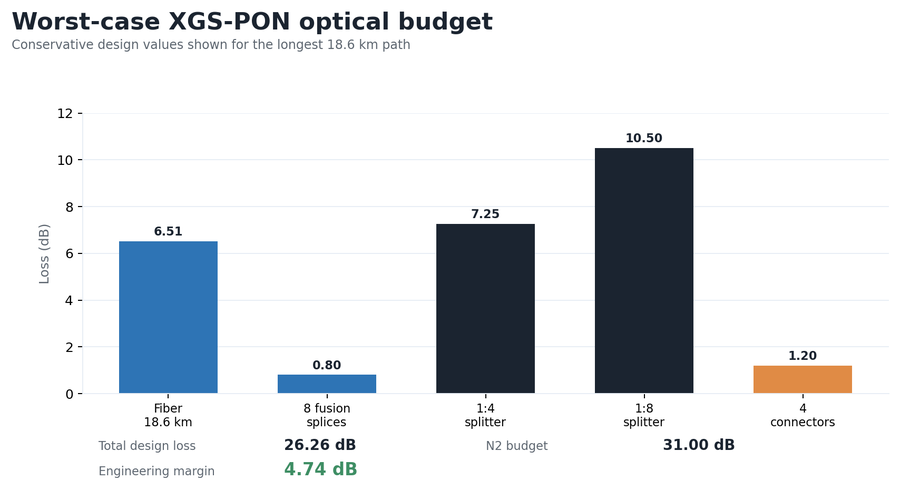
| Worst optical path | 18.6 km; 26.26 dB modeled loss against 31.00 dB N2 budget; 4.74 dB margin |
Key design decisions
Two-stage splitting is used because demand is dispersed along long rural roads; secondary splitters shorten drop tails and avoid concentrating every connection at one cabinet. A 24F feeder minimum is retained even though only 16 fibers are active, giving a transparent 33% cable-level reserve without inflating the route to a 144F cable. Terminal capacity is limited to 512 ports for 500 approved locations so spare capacity is visible rather than created by assigning unapproved locations. Pole-owner, highway, water-crossing and private-access dependencies are kept in a permit matrix so an unresolved approval never appears as a complete construction release.
Distribution-leg allocation
| Leg | 24F assignment | FDT range | Assigned premises | Port capacity | Route mi | Max path |
|---|---|---|---|---|---|---|
| A | F01-F16 active; F17-F24 spare | FDT-001 to 016 | 126 | 128 | 6.4 | 16.2 km |
| B | F01-F16 active; F17-F24 spare | FDT-017 to 032 | 124 | 128 | 5.8 | 18.6 km |
| C | F01-F16 active; F17-F24 spare | FDT-033 to 048 | 125 | 128 | 6.2 | 17.1 km |
| D | F01-F16 active; F17-F24 spare | FDT-049 to 064 | 125 | 128 | 6.2 | 15.7 km |
| TOTAL | 64 active outputs | 64 FDTs | 500 | 512 | 24.6 | 18.6 km |
Core procurement schedule
| Item | Planning quantity | Basis / control |
|---|---|---|
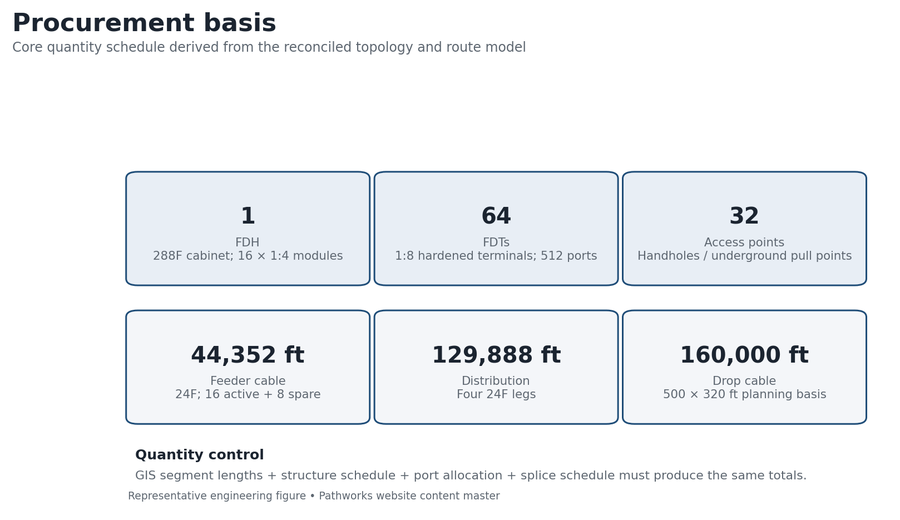
| FDH cabinet | 1 | 288F enclosure capacity; accepts 16 primary 1:4 modules and planned reserve |
| 1:4 splitter module | 16 | One per active OLT port; four distribution outputs each |
| 1:8 FDT | 64 | 512 hardened ports; two to four spare terminal ports retained per leg |
| 24F feeder cable | 44,352 ft | 8.4 mi GIS centerline basis; slack/waste added as a separate client factor |
| 24F distribution cable | 129,888 ft | Four leg schedules totaling 24.6 mi |
| Drop cable | 160,000 ft | 500 × 320 ft average planning allowance |
| Underground access points | 32 | Handholes/pull points from underground segment and pulling-section schedule |
QA steps and evidence
| QA gate | Acceptance test | Evidence / result |
|---|---|---|
| Location control | 500 unique approved IDs; each linked to one terminal port | Location-to-port crosswalk; zero duplicates or unassigned locations |
| Topology | Forward and reverse trace from OLT to premise | 16 PON paths, 64 secondary branches, 500 complete premise traces |
| Capacity | Assigned fibers and ports do not exceed schedule | 512 ports / 500 assigned; 24F leg reserve visible |
| Optical | Worst path checked with approved loss library | 26.26 dB loss; 4.74 dB N2 margin |
| Quantity | GIS lengths reconcile to cable and structure schedules | 33.0 route mi; separate 30.3 drop-cable mi |
| Release | Every redline closed or assigned to an exception owner | 30%, 90% and final issue checklists |
Revision record
| Revision | Trigger | Change made | Controlled outcome |
|---|---|---|---|
| R0 | 30% client review | Moved six FDT boundaries and rebalanced 27 premise assignments | No new PON ports; all four legs remain within 128-port capacity |
| R1 | 90% permit and pole screen | Rerouted 2.7 mi from the seed concept and shifted four access points | Route reduced to 33.0 mi; affected sheets, GIS, cable schedule and BOM reissued together |
Result and calculation trail
The design assigns all 500 approved locations to complete XGS-PON paths, provides 512 terminal ports and retains 12 unassigned terminal ports. Route optimization reduces the seed alignment from 35.7 to 33.0 miles, a 7.6% reduction, while the planning estimate moves from $9,460 to $8,940 per passing and the worst modeled path retains 4.74 dB of N2 optical margin.
Coverage: 500 assigned ÷ 500 approved = 100% of the representative approved location list. Route reduction: 35.7 seed miles − 33.0 final miles = 2.7 miles, or 7.6%. Capacity: 16 PON ports × 4 primary outputs × 8 secondary ports = 512 premise ports. Cost per passing: $4.47 million representative planning total ÷ 500 locations = $8,940.
Pathworks converted an approved 500-location demand layer and rural road/pole base into a coordinated XGS-PON construction package: serving zones, HLD/LLD, route classification, fiber assignments, splice logic, optical checks, quantities and issue-controlled construction prints, in 22 business days from approved input freeze to final design issue.
More case studies

Greenfield FTTH design for 500 homes, full OSP package from plat to BOM
Built to standard US ILEC/CLEC practice: a two-stage 1:4/1:8 split localizes fault response to a single FDT instead of the whole feeder, construction runs underground-first to meet HOA aesthetic requirements, and 20–30% spare fiber is held at every tier so the network can absorb infill lots without a re-trench. The design closes with 7.4 dB of optical margin against the 28 dB GPON Class B+ budget, enough headroom for a future 1:64 upgrade at a subset of FDTs.
Aerial FTTH design and pole make-ready analysis
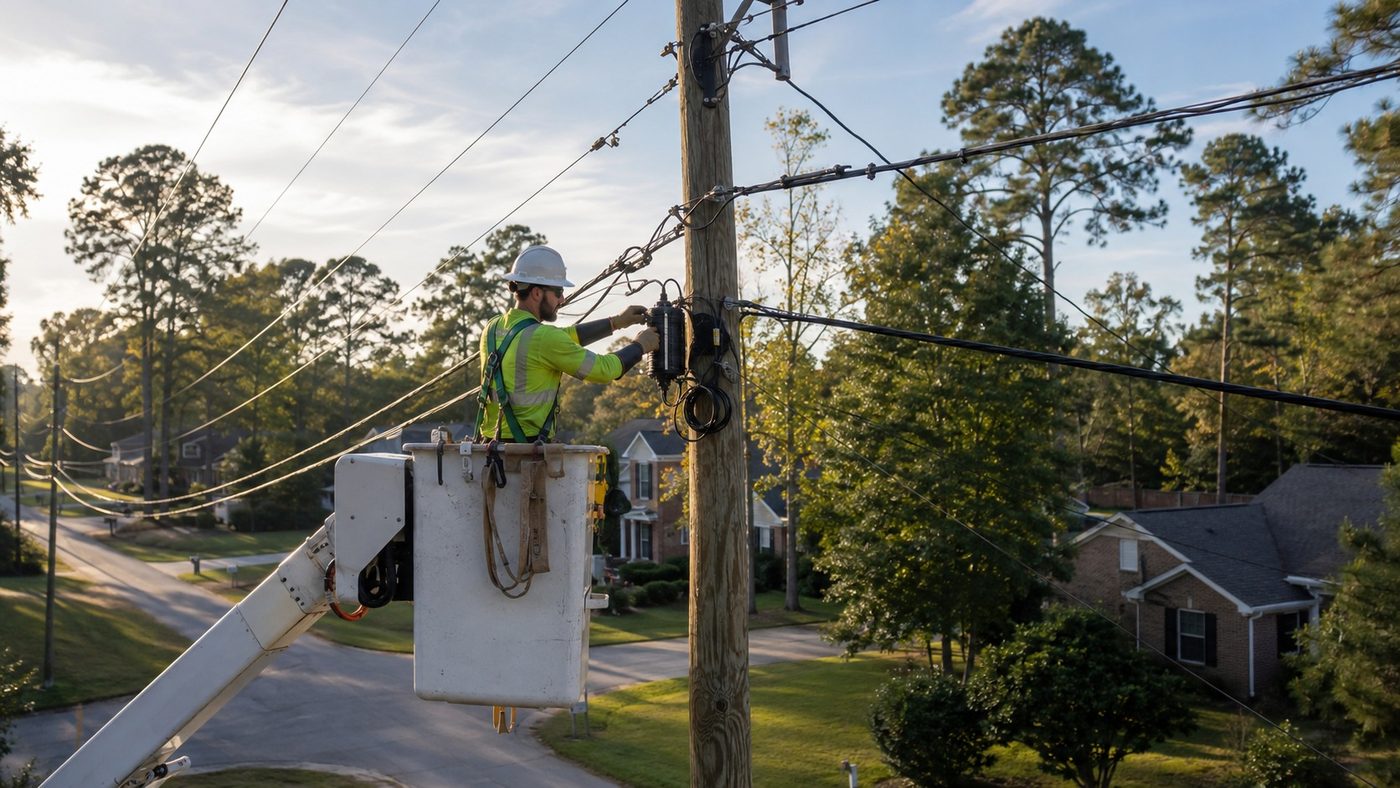
A pole-by-pole evidence record separates clean attachment candidates from conditions that require transfer, rearrangement, guying review or replacement. The modeled review identifies 226 make-ready or data conflicts across 1,946 poles; design adjustments resolve 141 before application packaging, including 15 avoided pole-replacement candidates, reaching 92% first-submission readiness.
Underground FTTH and right-of-way permit design
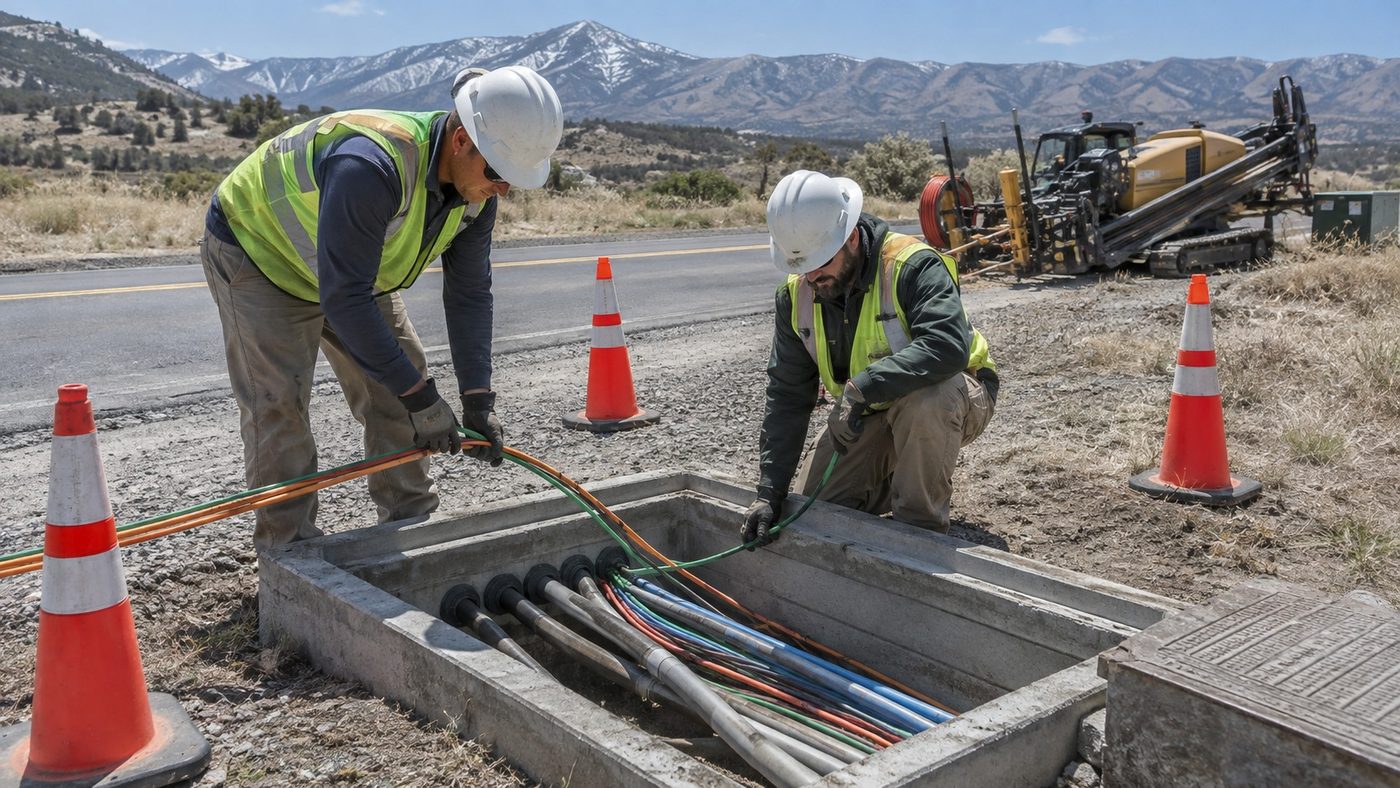
One connected network model is divided into nine jurisdiction-specific permit packages. The modeled design resolves 51 of 64 identified utility conflicts before permit issue, shortens the initial route by 1.9 miles, and the revised quantities indicate approximately $410,000 in avoided construction and restoration cost relative to the seed alignment.