
Brownfield fiber expansion and PON capacity upgrade
A municipal and regional ISP expanding an established GPON access network across Wisconsin and the western Great Lakes region.
- Input received
- OLT chassis/card/port exports and PON utilization, GIS cable/structure/terminal data and splice diagrams, cabinet audit sheets and OTDR/power records, and the client's proposed electronics and unit costs.
- Delivered
- An existing-condition reconciliation workbook, a capacity model by OLT port/splitter/cabinet/feeder, a GPON/XGS-PON overlay schematic and optical-budget workbook, incremental LLD construction sheets, and a phased migration matrix.
- Timeline
- 25 business days after the baseline record freeze and receipt of the approved electronics matrix.
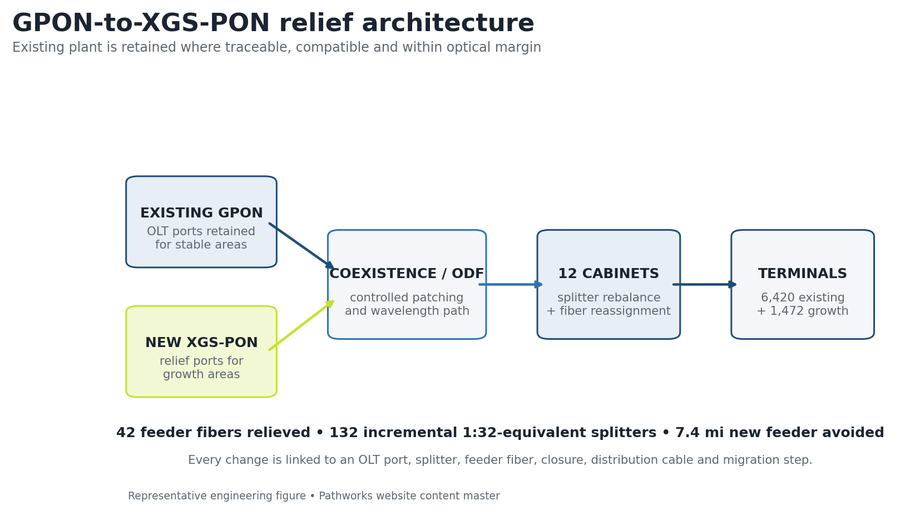
Brownfield planning starts by reconciling the live logical path before any new capacity is assigned. The modeled upgrade adds capacity for 1,472 premises, relieves 42 exhausted feeder fibers and reduces average splitter utilization from 87% to 68%; reuse and reassignment avoid 7.4 miles of new feeder construction, representing approximately $780,000 in the client-style planning model.
- Additional premises
- 1,472
- Fibers relieved
- 42
- Splitter utilization
- 87% → 68%
- Modeled avoidance
- $780k
The engineering problem
The network has grown through multiple construction programs, creating inconsistent cabinet names, partially exhausted feeder cables and splitter assignments that do not always match GIS or operations exports. Several growth areas cannot be served by simply adding terminals because upstream splitter ports or assigned fibers are unavailable. The upgrade model links OLT ports, splitter modules, feeder fibers, closures, distribution cables and terminals before any new capacity is assigned or a migration step is written, and every mismatch between operations exports, GIS and splice records is logged rather than silently resolved in favor of one source.
Design parameters and first-principles checks
| Existing footprint | 6,420 premises across 12 cabinets; 6,403 assigned usable ports in the baseline model |
|---|---|
| Growth | 1,472 incremental premise assignments |
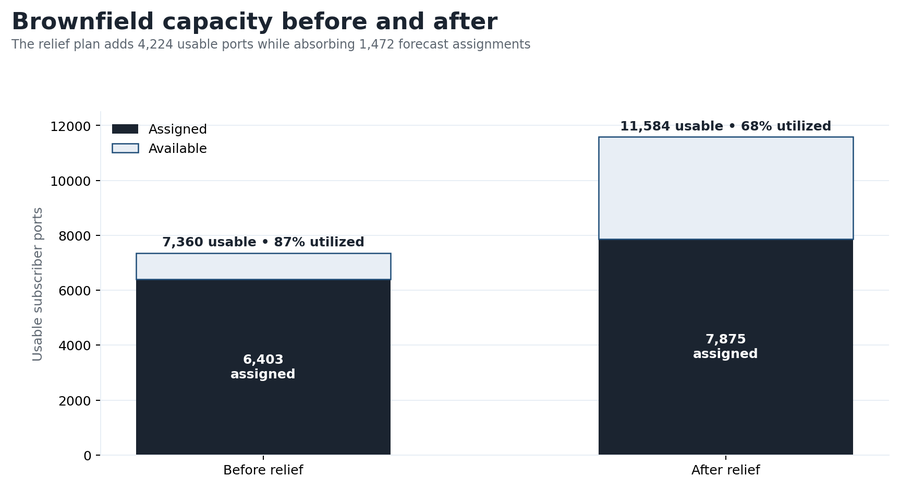
| Before capacity | 7,360 usable subscriber ports; 6,403 assigned; 87.0% utilized |
| After capacity | 11,584 usable ports; 7,875 assigned; 68.0% utilized |
| Passive relief | 132 incremental 1:32-equivalent splitter modules across 12 cabinets |
| Feeder relief | 42 exhausted/blocked feeder fibers reassigned or relieved |
| Construction avoided | 7.4 miles of new feeder; $20/ft representative planning rate; approximately $780k |
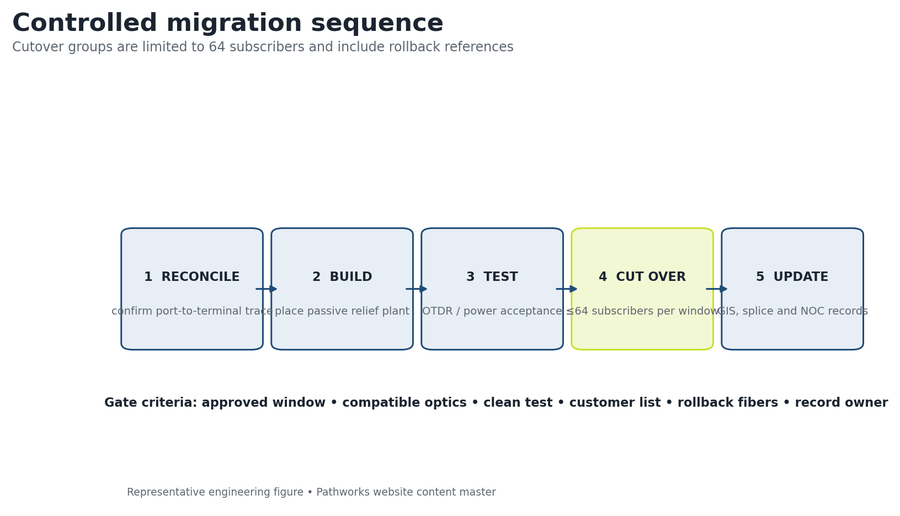
| Migration control | Cutover groups limited to 64 subscribers per maintenance window |
Key design decisions
Existing cable is reused only where the fiber path is traceable and the route, closure, connector and optical values meet the approved design basis. XGS-PON capacity is added selectively to growth areas while stable GPON service is retained where coexistence and hardware compatibility permit. Each cutover group is limited to 64 subscribers and includes test criteria, affected ports, rollback references and post-window record ownership.
Cabinet-cluster capacity model
| Cluster | Cabinets | Before assigned / usable | Growth | After assigned / usable | Fibers relieved | Feeder avoided |
|---|---|---|---|---|---|---|
| North | 3 | 1,612 / 1,840 | 382 | 1,994 / 2,896 | 11 | 1.9 mi |
| East | 3 | 1,408 / 1,600 | 316 | 1,724 / 2,560 | 9 | 1.6 mi |
| Central | 3 | 1,835 / 2,080 | 438 | 2,273 / 3,200 | 13 | 2.2 mi |
| West | 3 | 1,548 / 1,840 | 336 | 1,884 / 2,928 | 9 | 1.7 mi |
| TOTAL | 12 | 6,403 / 7,360 | 1,472 | 7,875 / 11,584 | 42 | 7.4 mi |
Sample XGS-PON optical path
| Loss element | Quantity / value | Allowance | Extended loss |
|---|---|---|---|
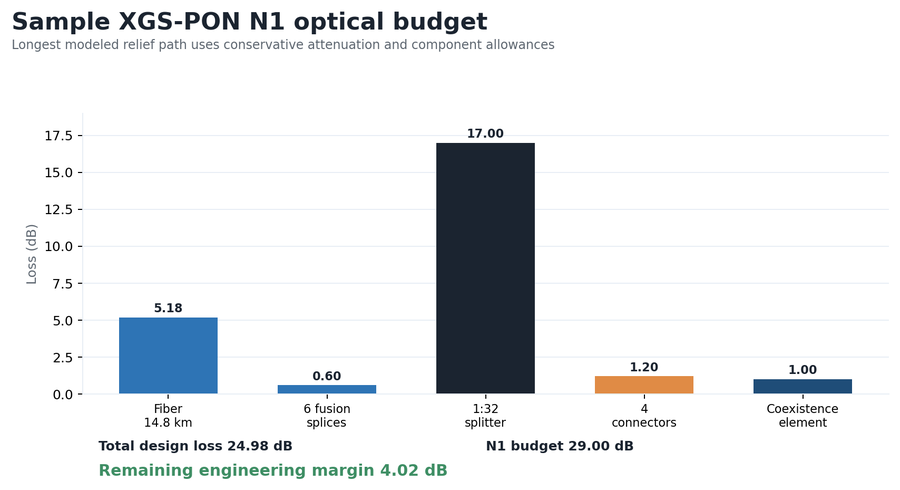
| Fiber | 14.8 km | 0.35 dB/km conservative planning value | 5.18 dB |
| Fusion splices | 6 | 0.10 dB each | 0.60 dB |
| 1:32 splitter | 1 | 17.00 dB | 17.00 dB |
| Connectors | 4 | 0.30 dB each | 1.20 dB |
| Coexistence element | 1 | 1.00 dB | 1.00 dB |
| TOTAL | N1 budget 29.00 dB | 24.98 dB loss / 4.02 dB margin |
QA steps and evidence
| QA gate | Acceptance test | Evidence / result |
|---|---|---|
| Baseline trace | OLT-to-terminal trace works forward and backward | Controlled discrepancy register; no multiply assigned fibers |
| Capacity | Before/after ports and assignments reconcile by cabinet | 6,403/7,360 before; 7,875/11,584 after |
| Optical | Every relief path checked with approved loss library | Sample worst path 24.98 dB; 4.02 dB N1 margin |
| Compatibility | OLT optics, coexistence, splitter and ONU path match matrix | Hardware/wavelength checklist by cutover group |
| Migration | ≤64 subscribers; prerequisites, test and rollback present | Approved work-package gate |
| Records | GIS, splice, fiber, capacity and NOC references agree | Post-cutover record checklist and owner |
Revision record
| Revision | Trigger | Change made | Controlled outcome |
|---|---|---|---|
| R0 | Baseline reconciliation | Resolved naming and fiber-assignment mismatches; held 63 items for client evidence | Controlled existing-condition model established |
| R1 | Capacity option review | Selected cabinet relief and fiber reuse over new-feeder option | 42 feeder fibers relieved; 7.4 mi new feeder avoided |
| R2 | Operations migration review | Reduced maximum cutover group from 96 to 64 and added rollback/test fields | Operator-ready phased migration matrix |
Result and calculation trail
The modeled upgrade adds capacity for 1,472 premises, relieves 42 exhausted feeder fibers and reduces average splitter utilization from 87% to 68%. Reuse and reassignment avoid 7.4 miles of new feeder construction, representing approximately $780,000 in the client-style planning model; migration packages are limited to 64 subscribers per step.
Before utilization: 6,403 assigned ÷ 7,360 usable = 87.0%. After utilization: 7,875 assigned ÷ 11,584 usable = 68.0%. Growth absorbed: 7,875 − 6,403 = 1,472. Feeder avoidance: 7.4 mi × 5,280 ft/mi × $20/ft = $781,440, reported as approximately $780,000.
Pathworks reconciled twelve cabinet areas, modeled GPON-to-XGS-PON relief and prepared phased migration packages for 1,472 incremental premises, relieving 42 feeder fibers and reusing existing plant to avoid 7.4 miles of modeled new-feeder construction.
More case studies

Greenfield FTTH design for 500 homes, full OSP package from plat to BOM
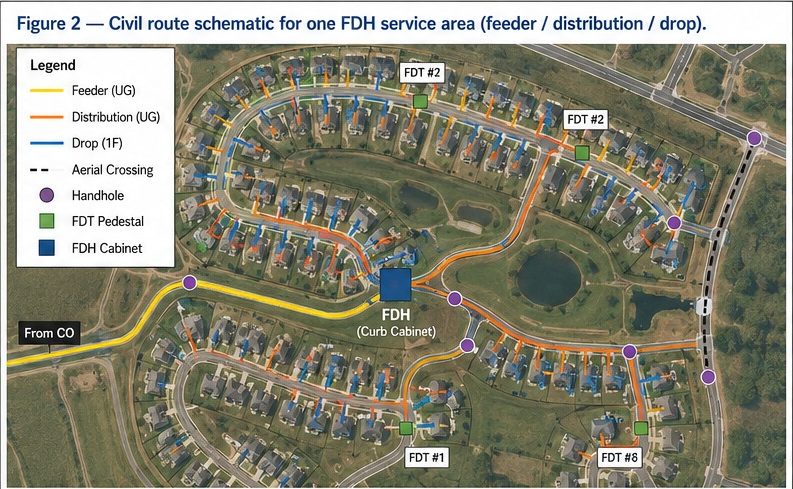
Built to standard US ILEC/CLEC practice: a two-stage 1:4/1:8 split localizes fault response to a single FDT instead of the whole feeder, construction runs underground-first to meet HOA aesthetic requirements, and 20–30% spare fiber is held at every tier so the network can absorb infill lots without a re-trench. The design closes with 7.4 dB of optical margin against the 28 dB GPON Class B+ budget, enough headroom for a future 1:64 upgrade at a subset of FDTs.

Rural greenfield FTTH design for a 500-location BEAD service area
A two-stage 1:32 split architecture assigns all 500 approved locations to complete XGS-PON paths across 512 terminal ports. Route optimization reduces the seed alignment from 35.7 to 33.0 miles, a 7.6% reduction, while the modeled planning cost falls from $9,460 to $8,940 per passing and the worst modeled path retains 4.74 dB of N2 optical margin.
Aerial FTTH design and pole make-ready analysis
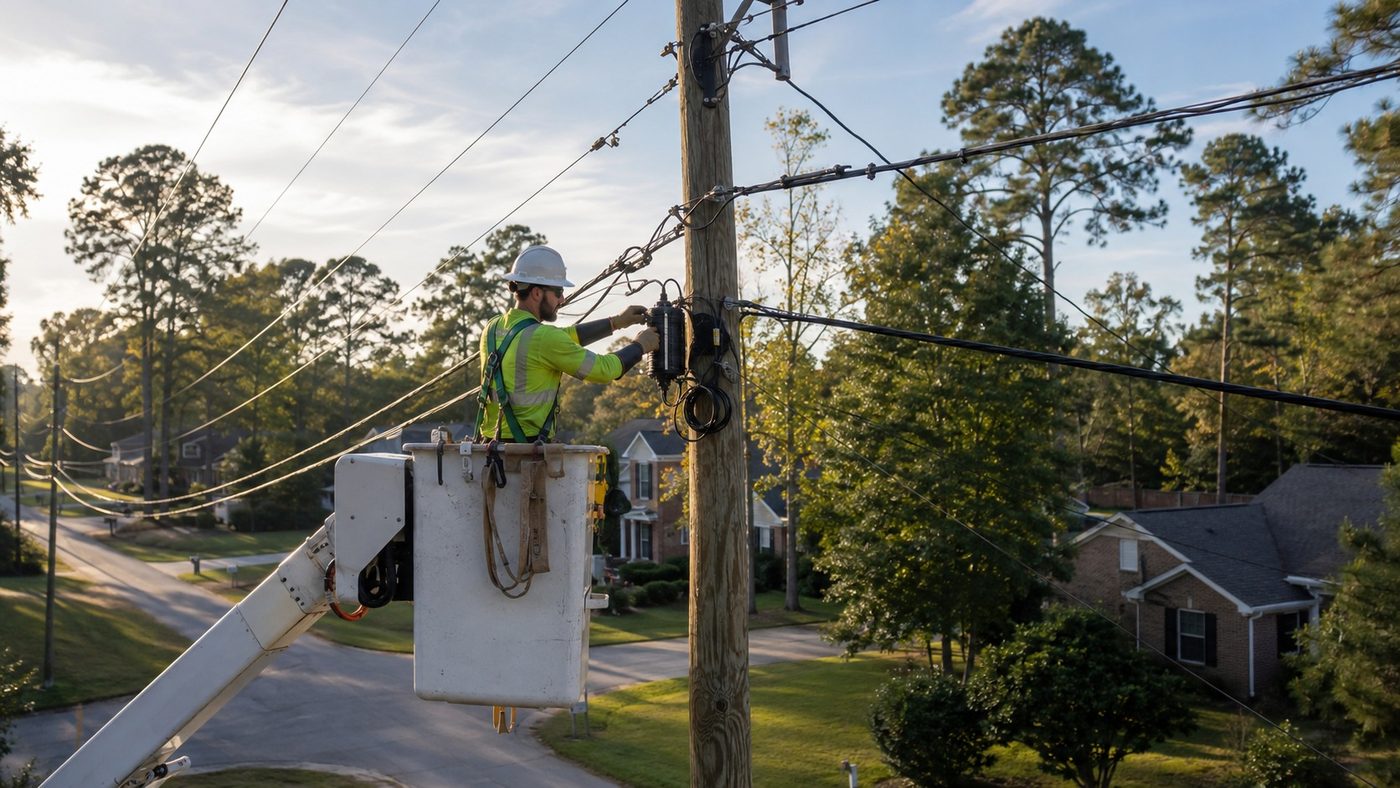
A pole-by-pole evidence record separates clean attachment candidates from conditions that require transfer, rearrangement, guying review or replacement. The modeled review identifies 226 make-ready or data conflicts across 1,946 poles; design adjustments resolve 141 before application packaging, including 15 avoided pole-replacement candidates, reaching 92% first-submission readiness.